FAA-H-8083-25C · Source PDF page 233
Flight Manuals and Other Documents
Weight and Loading Distribution · PHAK page 9-3
Searchable transcription
Maximum
245 II5
T 200 I00 P
M E °F I0 I5 0 0 60 20 P S I R E S Normal operating range
P S
75 0
OIL
Minimum
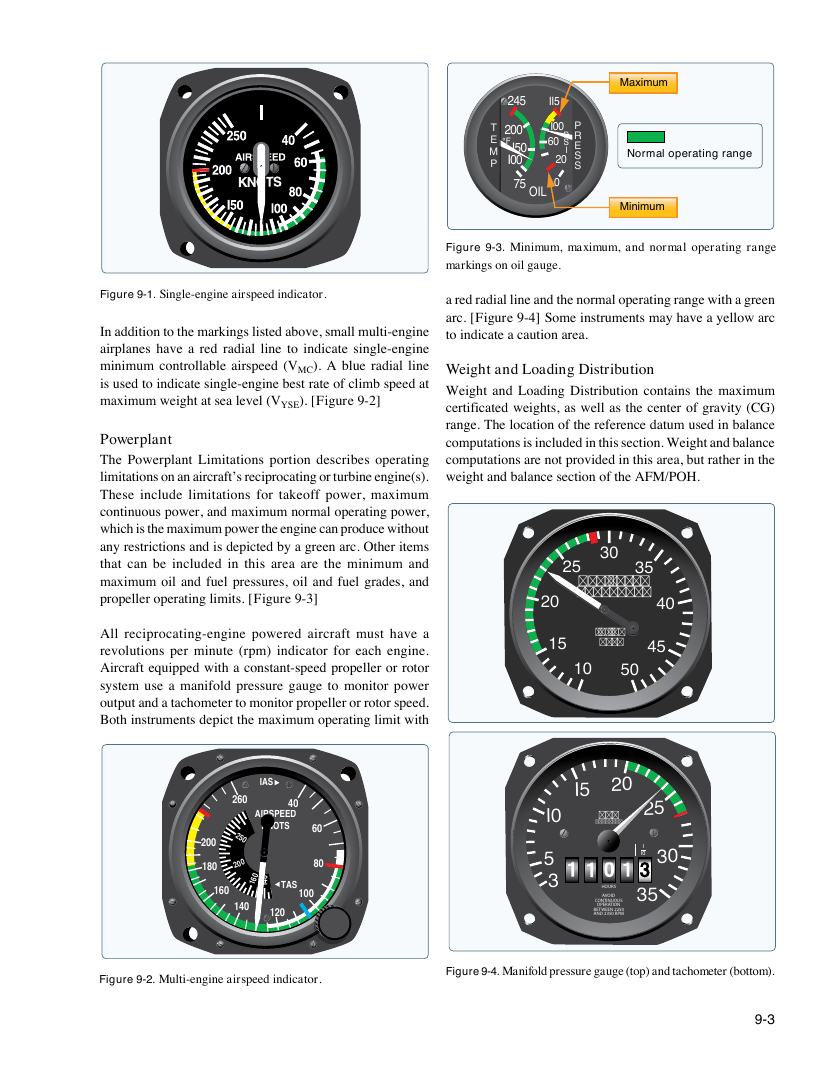
Figure 9-3. Minimum, maximum, and normal operating range
markings on oil gauge.
Figure 9-1. Single-engine airspeed indicator. a red radial line and the normal operating range with a green
arc. [Figure 9-4] Some instruments may have a yellow arc
In addition to the markings listed above, small multi-engine to indicate a caution area.
airplanes have a red radial line to indicate single-engine
minimum controllable airspeed (V MC ). A blue radial line Weight and Loading Distribution
is used to indicate single-engine best rate of climb speed at
Weight and Loading Distribution contains the maximum
maximum weight at sea level (V ). [Figure 9-2]
YSE certificated weights, as well as the center of gravity (CG)
range. The location of the reference datum used in balance
Powerplant computations is included in this section. Weight and balance
The Powerplant Limitations portion describes operating computations are not provided in this area, but rather in the
limitations on an aircraft’s reciprocating or turbine engine(s). weight and balance section of the AFM/POH.
These include limitations for takeoff power, maximum
continuous power, and maximum normal operating power,
which is the maximum power the engine can produce without
any restrictions and is depicted by a green arc. Other items
3300
that can be included in this area are the minimum and 2255 3355
maximum oil and fuel pressures, oil and fuel grades, and MANIFOLD
propeller operating limits. [Figure 9-3] 2200 PRESSURE 4400
All reciprocating-engine powered aircraft must have a IN Hg
revolutions per minute (rpm) indicator for each engine. 1155 ALg. 4455
Aircraft equipped with a constant-speed propeller or rotor 1100 5500
system use a manifold pressure gauge to monitor power
output and a tachometer to monitor propeller or rotor speed.
Both instruments depict the maximum operating limit with
IAS 2200
II55
260 40 2255
AIRSPEED II00 RPM
KNOTS 60 HUNDREDS
200
250
I
55 I0 3300
180 200 80
160
160041
TAS
100
33
HOU RS 3355
AVOID
140 C O O P N E T R IN AT U I O O U N S
120 A BE N T D W 2 E 3 E 5 N 0 2 R 2 P 5 M 0
Figure 9-4. Manifold pressure gauge (top) and tachometer (bottom).
Figure 9-2. Multi-engine airspeed indicator.
9-3