FAA-H-8083-25C · Source PDF page 275
Aircraft Performance
Performance Charts · PHAK page 11-19
Searchable transcription
maneuvering speed does not provide structural protection Each aircraft performs differently and, therefore, has different
against multiple full control inputs in one axis or full control performance numbers. Compute the performance of the
inputs in more than one axis at the same time. aircraft prior to every flight, as every flight is different. (See
appendix for examples of performance charts for a Cessna
V —the maximum speed for normal operation or the Model 172R and Challenger 605.)
N0
maximum structural cruising speed. This is the speed at
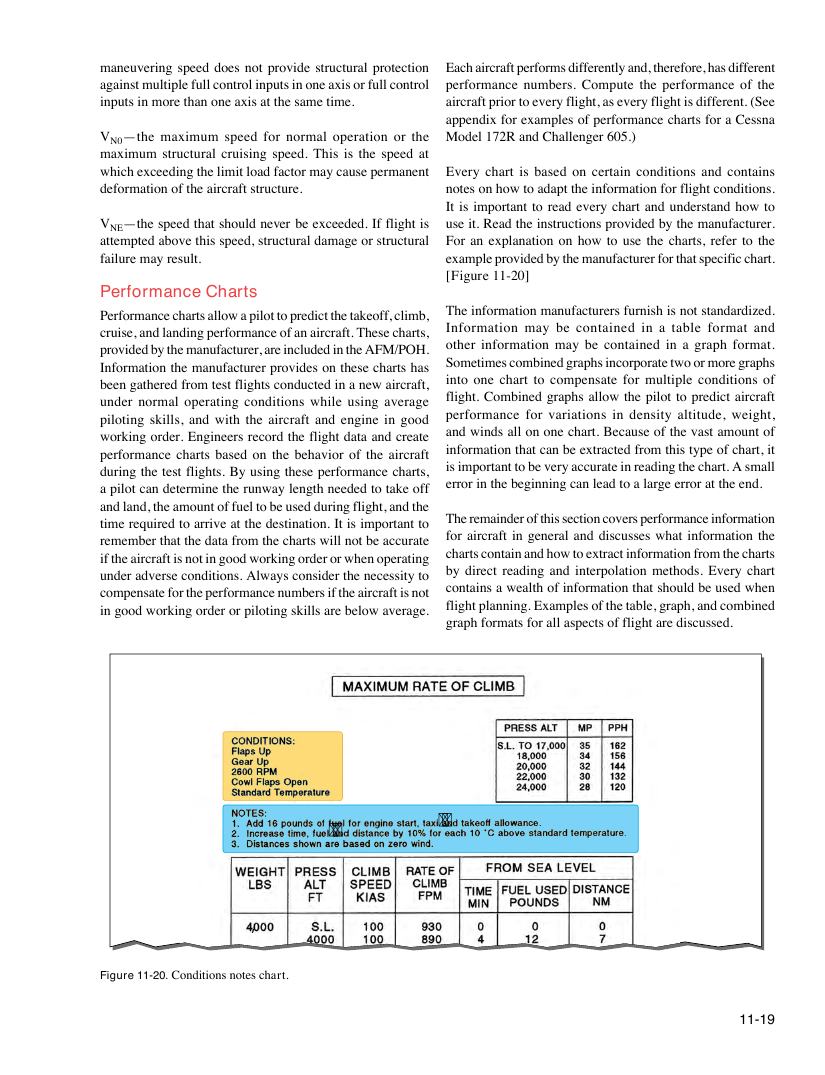
which exceeding the limit load factor may cause permanent Every chart is based on certain conditions and contains
deformation of the aircraft structure. notes on how to adapt the information for flight conditions.
It is important to read every chart and understand how to
V —the speed that should never be exceeded. If flight is use it. Read the instructions provided by the manufacturer.
NE
attempted above this speed, structural damage or structural For an explanation on how to use the charts, refer to the
failure may result. example provided by the manufacturer for that specific chart.
[Figure 11-20]
Performance Charts
The information manufacturers furnish is not standardized.
Performance charts allow a pilot to predict the takeoff, climb,
Information may be contained in a table format and
cruise, and landing performance of an aircraft. These charts,
other information may be contained in a graph format.
provided by the manufacturer, are included in the AFM/POH.
Sometimes combined graphs incorporate two or more graphs
Information the manufacturer provides on these charts has
into one chart to compensate for multiple conditions of
been gathered from test flights conducted in a new aircraft,
flight. Combined graphs allow the pilot to predict aircraft
under normal operating conditions while using average
performance for variations in density altitude, weight,
piloting skills, and with the aircraft and engine in good
and winds all on one chart. Because of the vast amount of
working order. Engineers record the flight data and create
information that can be extracted from this type of chart, it
performance charts based on the behavior of the aircraft
is important to be very accurate in reading the chart. A small
during the test flights. By using these performance charts,
error in the beginning can lead to a large error at the end.
a pilot can determine the runway length needed to take off
and land, the amount of fuel to be used during flight, and the
The remainder of this section covers performance information
time required to arrive at the destination. It is important to
for aircraft in general and discusses what information the
remember that the data from the charts will not be accurate
charts contain and how to extract information from the charts
if the aircraft is not in good working order or when operating
by direct reading and interpolation methods. Every chart
under adverse conditions. Always consider the necessity to
contains a wealth of information that should be used when
compensate for the performance numbers if the aircraft is not
flight planning. Examples of the table, graph, and combined
in good working order or piloting skills are below average.
graph formats for all aspects of flight are discussed.
,
,
,
Figure 11-20. Conditions notes chart.
11-19