FAA-H-8083-25C · Source PDF page 276
Aircraft Performance
Performance Charts · PHAK page 11-20
Searchable transcription
TAKEOFF DISTANCE
MAXIMUM WEIGHT 2,400 LB
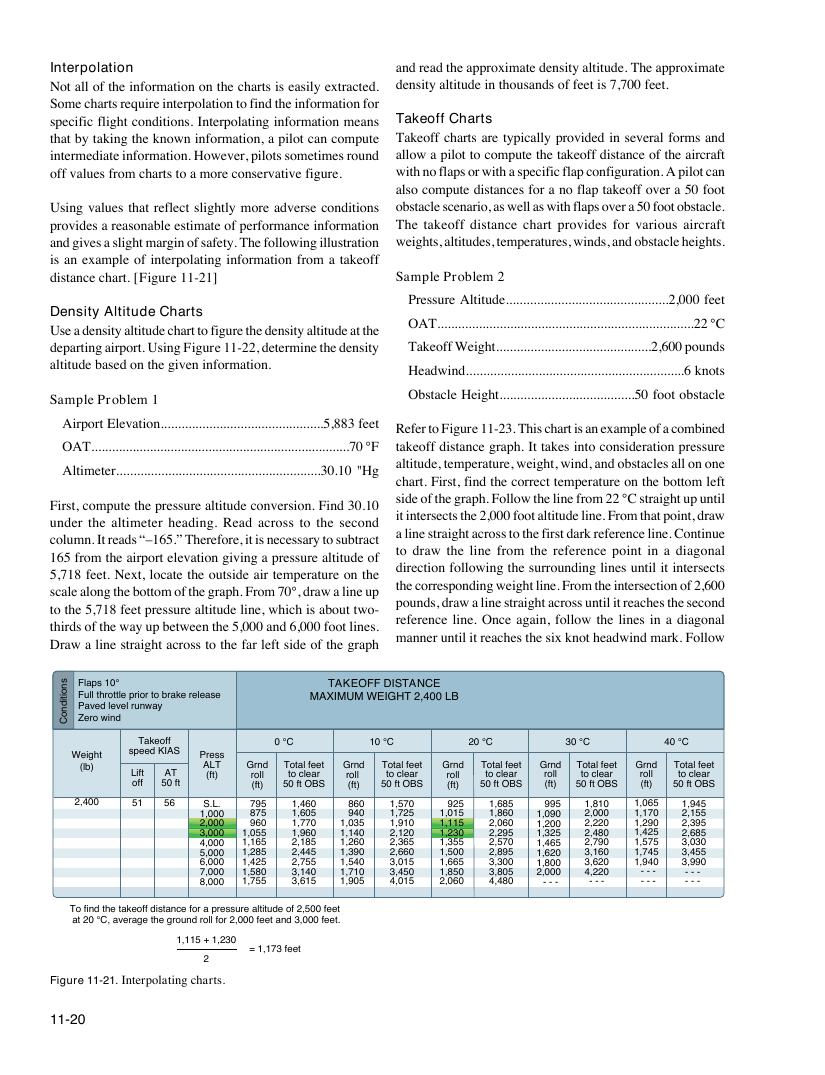
Figure 11-21. Interpolating charts.
11-20
snoitidnoC
Interpolation and read the approximate density altitude. The approximate
Not all of the information on the charts is easily extracted. density altitude in thousands of feet is 7,700 feet.
Some charts require interpolation to find the information for
specific flight conditions. Interpolating information means Takeoff Charts
that by taking the known information, a pilot can compute Takeoff charts are typically provided in several forms and
intermediate information. However, pilots sometimes round allow a pilot to compute the takeoff distance of the aircraft
off values from charts to a more conservative figure. with no flaps or with a specific flap configuration. A pilot can
also compute distances for a no flap takeoff over a 50 foot
Using values that reflect slightly more adverse conditions obstacle scenario, as well as with flaps over a 50 foot obstacle.
provides a reasonable estimate of performance information The takeoff distance chart provides for various aircraft
and gives a slight margin of safety. The following illustration weights, altitudes, temperatures, winds, and obstacle heights.
is an example of interpolating information from a takeoff
distance chart. [Figure 11-21] Sample Problem 2
Pressure Altitude...............................................2,000 feet
Density Altitude Charts
OAT..........................................................................22 °C
Use a density altitude chart to figure the density altitude at the
departing airport. Using Figure 11-22, determine the density Takeoff Weight.............................................2,600 pounds
altitude based on the given information.
Headwind...............................................................6 knots
Obstacle Height.......................................50 foot obstacle
Sample Problem 1
Airport Elevation...............................................5,883 feet
Refer to Figure 11-23. This chart is an example of a combined
OAT...........................................................................70 °F takeoff distance graph. It takes into consideration pressure
altitude, temperature, weight, wind, and obstacles all on one
Altimeter...........................................................30.10 "Hg
chart. First, find the correct temperature on the bottom left
side of the graph. Follow the line from 22 °C straight up until
First, compute the pressure altitude conversion. Find 30.10
it intersects the 2,000 foot altitude line. From that point, draw
under the altimeter heading. Read across to the second
a line straight across to the first dark reference line. Continue
column. It reads “–165.” Therefore, it is necessary to subtract
to draw the line from the reference point in a diagonal
165 from the airport elevation giving a pressure altitude of
direction following the surrounding lines until it intersects
5,718 feet. Next, locate the outside air temperature on the
the corresponding weight line. From the intersection of 2,600
scale along the bottom of the graph. From 70°, draw a line up
pounds, draw a line straight across until it reaches the second
to the 5,718 feet pressure altitude line, which is about two-
reference line. Once again, follow the lines in a diagonal
thirds of the way up between the 5,000 and 6,000 foot lines.
manner until it reaches the six knot headwind mark. Follow
Draw a line straight across to the far left side of the graph
Flaps 10°
Full throttle prior to brake release
Paved level runway
Zero wind
Takeoff 0 °C 10 °C 20 °C 30 °C 40 °C
speed KIAS
Weight Press
(lb) ALT Grnd Total feet Grnd Total feet Grnd Total feet Grnd Total feet Grnd Total feet
Lift AT (ft) roll to clear roll to clear roll to clear roll to clear roll to clear
off 50 ft (ft) 50 ft OBS (ft) 50 ft OBS (ft) 50 ft OBS (ft) 50 ft OBS (ft) 50 ft OBS
2,400 51 56 S.L. 795 1,460 860 1,570 925 1,685 995 1,810 1,065 1,945
1,000 875 1,605 940 1,725 1,015 1,860 1,090 2,000 1,170 2,155
2,000 960 1,770 1,035 1,910 1,115 2,060 1,200 2,220 1,290 2,395
3,000 1,055 1,960 1,140 2,120 1,230 2,295 1,325 2,480 1,425 2,685
4,000 1,165 2,185 1,260 2,365 1,355 2,570 1,465 2,790 1,575 3,030
5,000 1,285 2,445 1,390 2,660 1,500 2,895 1,620 3,160 1,745 3,455
6,000 1,425 2,755 1,540 3,015 1,665 3,300 1,800 3,620 1,940 3,990
7,000 1,580 3,140 1,710 3,450 1,850 3,805 2,000 4,220 - - - - - -
8,000 1,755 3,615 1,905 4,015 2,060 4,480 - - - - - - - - - - - -
To find the takeoff distance for a pressure altitude of 2,500 feet
at 20 °C, average the ground roll for 2,000 feet and 3,000 feet.
1,115 + 1,230
= 1,173 feet
2