FAA-H-8083-25C · Source PDF page 277
Aircraft Performance
Performance Charts · PHAK page 11-21
Searchable transcription
Outside air temperature
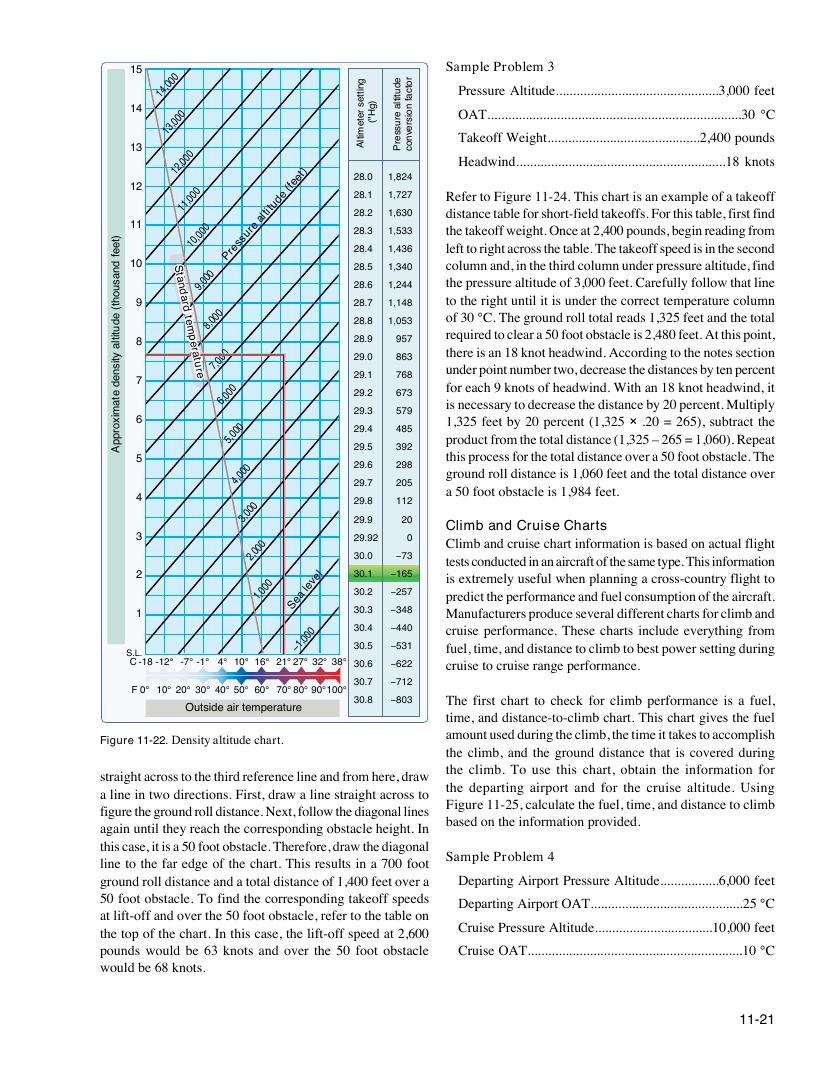
Figure 11-22. Density altitude chart.
11-21
)teef
dnasuoht(
edutitla
ytisned
etamixorppA
15
14,000
14 13,000
13
12,000
e
et)
28.0 1,824
12 11,000
altit
u
d e (f 2
2
8
8
.
.
1
2
1
1
,
,
7
6
2
3
7
0
11 10,000
Pr e s s
ur e 2
2
8
8
.
.
3
4
1
1
,
,
5
4
3
3
3
6
10 S ta
n
9,000 2
2
8
8
.
.
5
6
1
1
,
,
3
2
4
4
0
4
d
9 a r 28.7 1,148
d
te
m
8,000
28.8 1,053
8 p e 28.9 957
r a tu 7,000 29.0 863
r
e 29.1 768
7
6,000
29.2 673
29.3 579
6
5,000
29.4 485
29.5 392
5
4,000 29.6 298
29.7 205
4
3,000 2
2
9
9
.
.
8
9
11
20
2
3
2,000
2
3
9
0
.
.
9
0
2
−73
0
2 el 30.1 −165 1,000
e
a l
e v
30.2 −257
S
1 30.3 −348
–1,000 3
3
0
0
.
.
4
5
−
−
4
5
4
3
0
1
S.L.
C -18 -12° -7° -1° 4° 10° 16° 21° 27° 32° 38° 3 0.6 −622
30.7 −712
F 0° 10° 20° 30° 40° 50° 60° 70° 80° 90° 100°
30.8 −803
gnittes
retemitlA )gH"(
edutitla
erusserP
rotcaf
noisrevnoc
Sample Problem 3
Pressure Altitude...............................................3,000 feet
OAT.........................................................................30 °C
Takeoff Weight............................................2,400 pounds
Headwind............................................................18 knots
Refer to Figure 11-24. This chart is an example of a takeoff
distance table for short-field takeoffs. For this table, first find
the takeoff weight. Once at 2,400 pounds, begin reading from
left to right across the table. The takeoff speed is in the second
column and, in the third column under pressure altitude, find
the pressure altitude of 3,000 feet. Carefully follow that line
to the right until it is under the correct temperature column
of 30 °C. The ground roll total reads 1,325 feet and the total
required to clear a 50 foot obstacle is 2,480 feet. At this point,
there is an 18 knot headwind. According to the notes section
under point number two, decrease the distances by ten percent
for each 9 knots of headwind. With an 18 knot headwind, it
is necessary to decrease the distance by 20 percent. Multiply
1,325 feet by 20 percent (1,325 × .20 = 265), subtract the
product from the total distance (1,325 – 265 = 1,060). Repeat
this process for the total distance over a 50 foot obstacle. The
ground roll distance is 1,060 feet and the total distance over
a 50 foot obstacle is 1,984 feet.
Climb and Cruise Charts
Climb and cruise chart information is based on actual flight
tests conducted in an aircraft of the same type. This information
is extremely useful when planning a cross-country flight to
predict the performance and fuel consumption of the aircraft.
Manufacturers produce several different charts for climb and
cruise performance. These charts include everything from
fuel, time, and distance to climb to best power setting during
cruise to cruise range performance.
The first chart to check for climb performance is a fuel,
time, and distance-to-climb chart. This chart gives the fuel
amount used during the climb, the time it takes to accomplish
the climb, and the ground distance that is covered during
the climb. To use this chart, obtain the information for
straight across to the third reference line and from here, draw
the departing airport and for the cruise altitude. Using
a line in two directions. First, draw a line straight across to
Figure 11-25, calculate the fuel, time, and distance to climb
figure the ground roll distance. Next, follow the diagonal lines
based on the information provided.
again until they reach the corresponding obstacle height. In
this case, it is a 50 foot obstacle. Therefore, draw the diagonal
Sample Problem 4
line to the far edge of the chart. This results in a 700 foot
ground roll distance and a total distance of 1,400 feet over a Departing Airport Pressure Altitude.................6,000 feet
50 foot obstacle. To find the corresponding takeoff speeds
Departing Airport OAT............................................25 °C
at lift-off and over the 50 foot obstacle, refer to the table on
Cruise Pressure Altitude..................................10,000 feet
the top of the chart. In this case, the lift-off speed at 2,600
pounds would be 63 knots and over the 50 foot obstacle Cruise OAT..............................................................10 °C
would be 68 knots.