FAA-H-8083-25C · Source PDF page 279
Aircraft Performance
Performance Charts · PHAK page 11-23
Searchable transcription
20 1 ,0 8
1
0 ,0
6
0 0
, 1 0
0
4 0
1
, 0 0
2
P
0
,0
r
0
e
0
s
0
sure ALT - feet
Cruise
F u el - g
all o n s
Ti m e -
m i n
D
u
i
t
s
e
t
s
ance -
nautical miles
Associated conditions
10,000 Maximum continuous power*
3,600 lb gross weight
8,000
Flaps up
6,000 90 KIAS
4,000 No wind
* 2,700 rpm & 36 in M.P. (3-blade prop)
2,000 2,575 rpm & 36 in M.P. (2-blade prop)
Departure
Sea level
-40° -30° -20° -10° 0° 10° 20° 30° 40°C 0 10 20 30 40 50
Outside air temperature Fuel, time and distance to climb
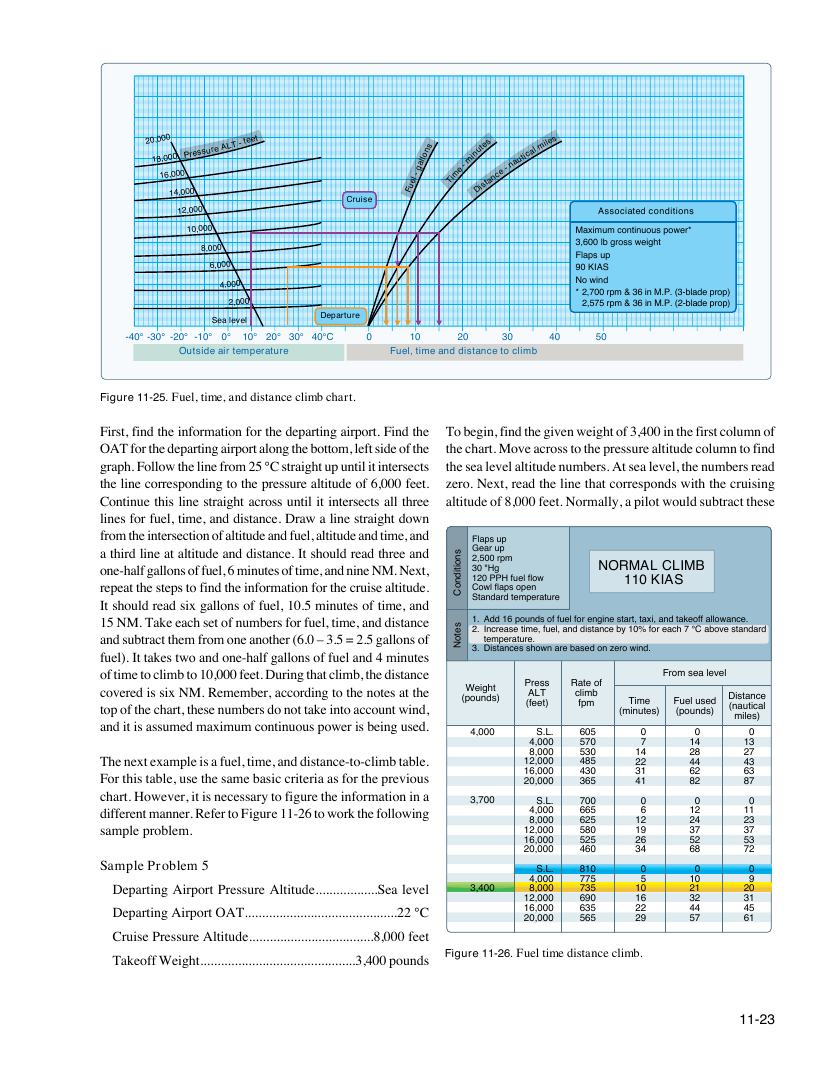
Figure 11-25. Fuel, time, and distance climb chart.
Figure 11-26. Fuel time distance climb.
11-23
snoitidnoC
setoN
First, find the information for the departing airport. Find the To begin, find the given weight of 3,400 in the first column of
OAT for the departing airport along the bottom, left side of the the chart. Move across to the pressure altitude column to find
graph. Follow the line from 25 °C straight up until it intersects the sea level altitude numbers. At sea level, the numbers read
the line corresponding to the pressure altitude of 6,000 feet. zero. Next, read the line that corresponds with the cruising
Continue this line straight across until it intersects all three altitude of 8,000 feet. Normally, a pilot would subtract these
lines for fuel, time, and distance. Draw a line straight down
from the intersection of altitude and fuel, altitude and time, and
Flaps up
a third line at altitude and distance. It should read three and Gear up
2,500 rpm
one-half gallons of fuel, 6 minutes of time, and nine NM. Next, 30 "Hg NORMAL CLIMB
120 PPH fuel flow 110 KIAS
repeat the steps to find the information for the cruise altitude. Cowl flaps open
Standard temperature
It should read six gallons of fuel, 10.5 minutes of time, and
15 NM. Take each set of numbers for fuel, time, and distance 1. Add 16 pounds of fuel for engine start, taxi, and takeoff allowance.
2. Increase time, fuel, and distance by 10% for each 7 °C above standard
and subtract them from one another (6.0 – 3.5 = 2.5 gallons of temperature.
3. Distances shown are based on zero wind.
fuel). It takes two and one-half gallons of fuel and 4 minutes
of time to climb to 10,000 feet. During that climb, the distance From sea level
Press Rate of
c to o p v e o r f e t d h e is c s h i a x r t N , t M he . s R e e n m um em be b r e s r d , o ac n c o o t r t d a i k n e g i t n o t o th a e c c n o o u te n s t w at i n th d e , (p W o e u i n g d h s t ) ( A fe L e T t) c f l p im m b (m T in im ut e es) F (p u o e u l u n s d e s) d D (n is a t u a t n ic c a e l
miles)
and it is assumed maximum continuous power is being used.
4,000 S.L. 605 0 0 0
4,000 570 7 14 13
8,000 530 14 28 27
The next example is a fuel, time, and distance-to-climb table. 12,000 485 22 44 43
16,000 430 31 62 63
For this table, use the same basic criteria as for the previous
20,000 365 41 82 87
chart. However, it is necessary to figure the information in a
3,700 S.L. 700 0 0 0
different manner. Refer to Figure 11-26 to work the following 4,000 665 6 12 11
8,000 625 12 24 23
sample problem. 12,000 580 19 37 37
16,000 525 26 52 53
20,000 460 34 68 72
Sample Problem 5
S.L. 810 0 0 0
4,000 775 5 10 9
Departing Airport Pressure Altitude..................Sea level 3,400 8,000 735 10 21 20
12,000 690 16 32 31
Departing Airport OAT............................................22 °C 16,000 635 22 44 45
20,000 565 29 57 61
Cruise Pressure Altitude....................................8,000 feet
Takeoff Weight.............................................3,400 pounds