FAA-H-8083-25C · Source PDF page 280
Aircraft Performance
Performance Charts · PHAK page 11-24
Searchable transcription
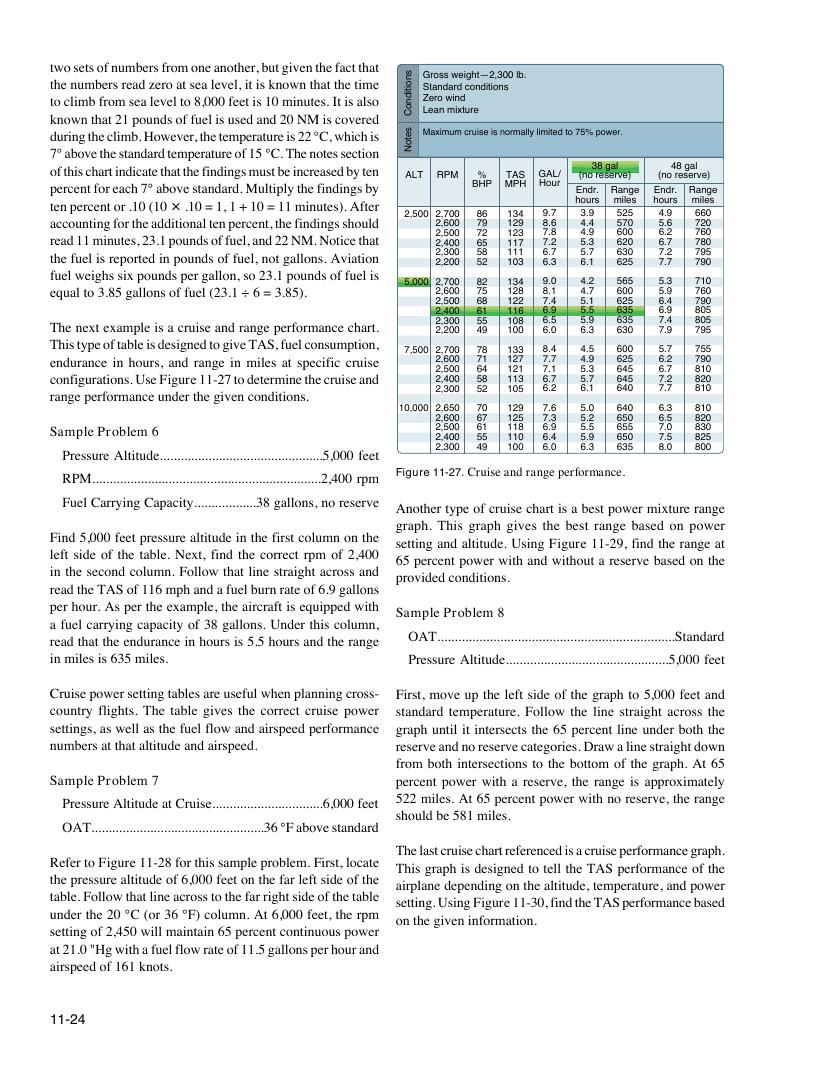
Figure 11-27. Cruise and range performance.
11-24
snoitidnoC
setoN
two sets of numbers from one another, but given the fact that
Gross weight—2,300 lb.
the numbers read zero at sea level, it is known that the time
Standard conditions
to climb from sea level to 8,000 feet is 10 minutes. It is also Zero wind
Lean mixture
known that 21 pounds of fuel is used and 20 NM is covered
during the climb. However, the temperature is 22 °C, which is Maximum cruise is normally limited to 75% power.
7° above the standard temperature of 15 °C. The notes section
of this chart indicate that the findings must be increased by ten 38 gal 48 gal
ALT RPM % TAS GAL/ (no reserve) (no reserve)
percent for each 7° above standard. Multiply the findings by BHP MPH Hour Endr. Range Endr. Range
ten percent or .10 (10 × .10 = 1, 1 + 10 = 11 minutes). After hours miles hours miles
2,500 2,700 86 134 9.7 3.9 525 4.9 660
accounting for the additional ten percent, the findings should 2,600 79 129 8.6 4.4 570 5.6 720
2,500 72 123 7.8 4.9 600 6.2 760
read 11 minutes, 23.1 pounds of fuel, and 22 NM. Notice that 2,400 65 117 7.2 5.3 620 6.7 780
the fuel is reported in pounds of fuel, not gallons. Aviation 2,300 58 111 6.7 5.7 630 7.2 795
2,200 52 103 6.3 6.1 625 7.7 790
fuel weighs six pounds per gallon, so 23.1 pounds of fuel is
5,000 2,700 82 134 9.0 4.2 565 5.3 710
equal to 3.85 gallons of fuel (23.1 ÷ 6 = 3.85). 2,600 75 128 8.1 4.7 600 5.9 760
2,500 68 122 7.4 5.1 625 6.4 790
2,400 61 116 6.9 5.5 635 6.9 805
2,300 55 108 6.5 5.9 635 7.4 805
The next example is a cruise and range performance chart.
2,200 49 100 6.0 6.3 630 7.9 795
This type of table is designed to give TAS, fuel consumption,
7,500 2,700 78 133 8.4 4.5 600 5.7 755
endurance in hours, and range in miles at specific cruise 2,600 71 127 7.7 4.9 625 6.2 790
2,500 64 121 7.1 5.3 645 6.7 810
configurations. Use Figure 11-27 to determine the cruise and 2,400 58 113 6.7 5.7 645 7.2 820
2,300 52 105 6.2 6.1 640 7.7 810
range performance under the given conditions.
10,000 2,650 70 129 7.6 5.0 640 6.3 810
2,600 67 125 7.3 5.2 650 6.5 820
Sample Problem 6 2,500 61 118 6.9 5.5 655 7.0 830
2,400 55 110 6.4 5.9 650 7.5 825
2,300 49 100 6.0 6.3 635 8.0 800
Pressure Altitude...............................................5,000 feet
RPM..................................................................2,400 rpm
Fuel Carrying Capacity..................38 gallons, no reserve
Another type of cruise chart is a best power mixture range
graph. This graph gives the best range based on power
Find 5,000 feet pressure altitude in the first column on the
setting and altitude. Using Figure 11-29, find the range at
left side of the table. Next, find the correct rpm of 2,400
65 percent power with and without a reserve based on the
in the second column. Follow that line straight across and
provided conditions.
read the TAS of 116 mph and a fuel burn rate of 6.9 gallons
per hour. As per the example, the aircraft is equipped with
Sample Problem 8
a fuel carrying capacity of 38 gallons. Under this column,
OAT....................................................................Standard
read that the endurance in hours is 5.5 hours and the range
in miles is 635 miles. Pressure Altitude...............................................5,000 feet
Cruise power setting tables are useful when planning cross- First, move up the left side of the graph to 5,000 feet and
country flights. The table gives the correct cruise power standard temperature. Follow the line straight across the
settings, as well as the fuel flow and airspeed performance graph until it intersects the 65 percent line under both the
numbers at that altitude and airspeed. reserve and no reserve categories. Draw a line straight down
from both intersections to the bottom of the graph. At 65
Sample Problem 7 percent power with a reserve, the range is approximately
522 miles. At 65 percent power with no reserve, the range
Pressure Altitude at Cruise................................6,000 feet
should be 581 miles.
OAT..................................................36 °F above standard
The last cruise chart referenced is a cruise performance graph.
Refer to Figure 11-28 for this sample problem. First, locate
This graph is designed to tell the TAS performance of the
the pressure altitude of 6,000 feet on the far left side of the
airplane depending on the altitude, temperature, and power
table. Follow that line across to the far right side of the table
setting. Using Figure 11-30, find the TAS performance based
under the 20 °C (or 36 °F) column. At 6,000 feet, the rpm
on the given information.
setting of 2,450 will maintain 65 percent continuous power
at 21.0 "Hg with a fuel flow rate of 11.5 gallons per hour and
airspeed of 161 knots.