FAA-H-8083-25C · Source PDF page 296
Weather Theory
Atmospheric Stability · PHAK page 12-12
Searchable transcription
Wind and Pressure Representation on Surface
Weather Maps
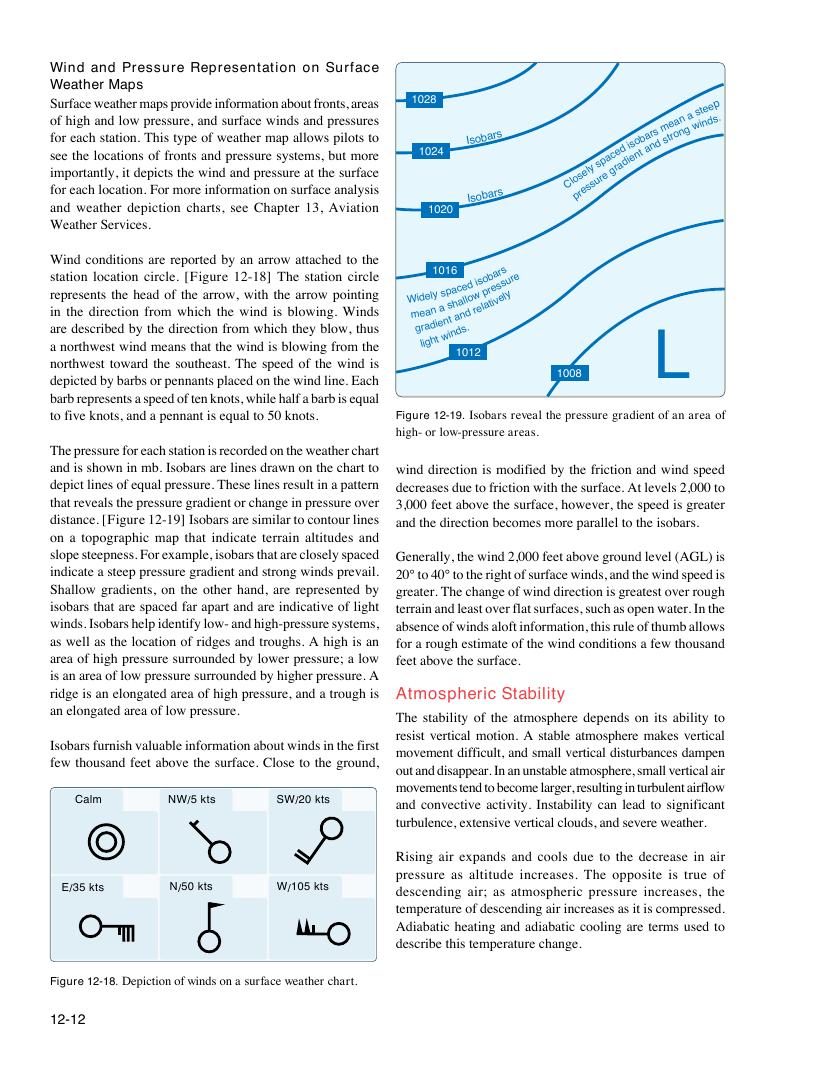
S o f s i f m o o e f u r e r r p h f e e o t i a a h a g r c c c e t h e a h h n l w a o l s t n o e l c t d y a c a a , t a t t l i h i t i o o o i t e o w n n r d n . s m e . p T p o a F r h i f e p o c i s s s t f r s s r p u m t o y t r r n h o o e p t e v , r e s e i a w d a o n i e n i f n d n d i f w n d o s f p e r u o a m r a r n r e f t m a d h a s t s c e a i p u e r o t r r i n o m e e w s n o a i s s n n a y p u d b s r s a s o e t u e l u l r a a m o t f n t a f w s d t r c , h o s e p b e n p a r u t s e s i n t l u s , a o m s a r l t f u r y s a o e r s c e a r t i o e e s s s 10 1 2 0 8 24 I I s s o o b b a a r r s s Clo p s re e s ly s u s r p e a g c r e a d d i i e s n o t b a a n rs d m st e ro a n n g a w s i t n e d e s p .
and weather depiction charts, see Chapter 13, Aviation
1020
Weather Services.
Wind conditions are reported by an arrow attached to the
s r i a a n e t r a n p e t t o r i h d e o r e e s t n h e s d w c n l i r t o e r i s c b e s a c t t e h t t d w i i e o o b i n n n h y d e c f a t r i m h d o r e c m e o l a d e f n i . w r s t e [ h h F c t e i h t c i i a g a o h t r u n r t r t o h h e f w e r e o 1 , w m w 2 w i - i n 1 n w i d t 8 d h h ] i i s i t c s h T h b e h b l t o e l a h o w r e s w r y i t o n a i w n g b ti g l o f o p . n r w o o W i m c , n i i t t r n h i t c n h u d l g e e s s W m g i d e l r i a g e a d h n ly 1 i t e a 0 s w n p 1 s i t n a h 6 a d c a n s e l d l . d o w r i e s l o p a b r t e i a v s r e s s ly ure L
1012
northwest toward the southeast. The speed of the wind is
1008
depicted by barbs or pennants placed on the wind line. Each
barb represents a speed of ten knots, while half a barb is equal
to five knots, and a pennant is equal to 50 knots. Figure 12-19. Isobars reveal the pressure gradient of an area of
high- or low-pressure areas.
The pressure for each station is recorded on the weather chart
and is shown in mb. Isobars are lines drawn on the chart to wind direction is modified by the friction and wind speed
depict lines of equal pressure. These lines result in a pattern decreases due to friction with the surface. At levels 2,000 to
that reveals the pressure gradient or change in pressure over 3,000 feet above the surface, however, the speed is greater
distance. [Figure 12-19] Isobars are similar to contour lines and the direction becomes more parallel to the isobars.
on a topographic map that indicate terrain altitudes and
slope steepness. For example, isobars that are closely spaced Generally, the wind 2,000 feet above ground level (AGL) is
indicate a steep pressure gradient and strong winds prevail. 20° to 40° to the right of surface winds, and the wind speed is
Shallow gradients, on the other hand, are represented by greater. The change of wind direction is greatest over rough
isobars that are spaced far apart and are indicative of light terrain and least over flat surfaces, such as open water. In the
winds. Isobars help identify low- and high-pressure systems, absence of winds aloft information, this rule of thumb allows
as well as the location of ridges and troughs. A high is an for a rough estimate of the wind conditions a few thousand
area of high pressure surrounded by lower pressure; a low feet above the surface.
is an area of low pressure surrounded by higher pressure. A
ridge is an elongated area of high pressure, and a trough is Atmospheric Stability
an elongated area of low pressure.
The stability of the atmosphere depends on its ability to
resist vertical motion. A stable atmosphere makes vertical
Isobars furnish valuable information about winds in the first
movement difficult, and small vertical disturbances dampen
few thousand feet above the surface. Close to the ground,
out and disappear. In an unstable atmosphere, small vertical air
movements tend to become larger, resulting in turbulent airflow
Calm NW/5 kts SW/20 kts and convective activity. Instability can lead to significant
turbulence, extensive vertical clouds, and severe weather.
Rising air expands and cools due to the decrease in air
pressure as altitude increases. The opposite is true of
E/35 kts N/50 kts W/105 kts descending air; as atmospheric pressure increases, the
temperature of descending air increases as it is compressed.
Adiabatic heating and adiabatic cooling are terms used to
describe this temperature change.
Figure 12-18. Depiction of winds on a surface weather chart.
12-12