FAA-H-8083-25C · Source PDF page 303
Weather Theory
Flight Toward an Approaching Warm Front · PHAK page 12-19
Searchable transcription
steadily from the inflow of relatively warmer air. For the most
Symbols for surface fronts and other significant lines
part, the dew point remains steady and the pressure levels off.
shown on the surface analysis chart
After the passage of a warm front, stratocumulus clouds
Warm front (red)*
predominate and rain showers are possible. The visibility
Cold front (blue)* eventually improves, but hazy conditions may exist for a
short period after passage. The wind blows from the south-
Stationary front (red/blue)* southwest. With warming temperatures, the dew point
rises and then levels off. There is generally a slight rise in
Occluded front (purple)*
barometric pressure, followed by a decrease of barometric
* Note: Fronts may be black and white or color depending on their pressure.
source. Also, fronts shown in color code do not necessarily show
frontal symbols.
Flight Toward an Approaching Warm Front
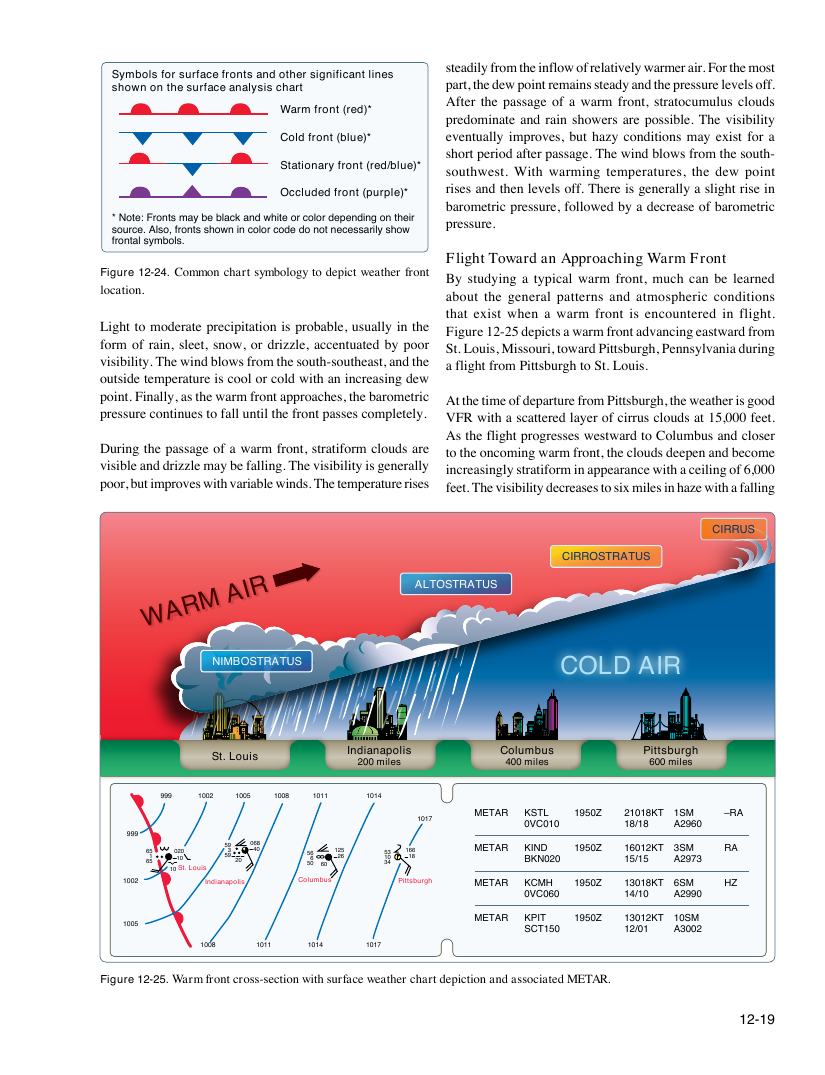
Figure 12-24. Common chart symbology to depict weather front By studying a typical warm front, much can be learned
location.
about the general patterns and atmospheric conditions
that exist when a warm front is encountered in flight.
Light to moderate precipitation is probable, usually in the Figure 12-25 depicts a warm front advancing eastward from
form of rain, sleet, snow, or drizzle, accentuated by poor St. Louis, Missouri, toward Pittsburgh, Pennsylvania during
visibility. The wind blows from the south-southeast, and the a flight from Pittsburgh to St. Louis.
outside temperature is cool or cold with an increasing dew
point. Finally, as the warm front approaches, the barometric At the time of departure from Pittsburgh, the weather is good
pressure continues to fall until the front passes completely. VFR with a scattered layer of cirrus clouds at 15,000 feet.
As the flight progresses westward to Columbus and closer
During the passage of a warm front, stratiform clouds are to the oncoming warm front, the clouds deepen and become
visible and drizzle may be falling. The visibility is generally increasingly stratiform in appearance with a ceiling of 6,000
poor, but improves with variable winds. The temperature rises feet. The visibility decreases to six miles in haze with a falling
CIRRUS
CIRROSTRATUS
R
AI ALTOSTRATUS
M
R
A
W
NIMBOSTRATUS COLD AIR
Indianapolis Columbus Pittsburgh
St. Louis
200 miles 400 miles 600 miles
999 1002 1005 1008 1011 1014
METAR KSTL 1950Z 21018KT 1SM –RA
1017 0VC010 18/18 A2960
999
6 6 5 1 5 10 0 1 2 S 0 0 t. Louis 5 5 9 3 9 20 0 4 6 0 8 5 5 6 6 0 60 1 2 2 6 5 5 1 3 3 0 4 1 1 6 8 6 M E T A R K B I K N N D 0 20 1 950Z 1 1 6 5 0 /1 1 5 2 K T 3 A S 2 M 97 3 RA
1002 Indianapolis Columbus Pittsburgh METAR KCMH 1950Z 13018KT 6SM HZ
0VC060 14/10 A2990
METAR KPIT 1950Z 13012KT 10SM
1005 SCT150 12/01 A3002
1008 1011 1014 1017
Figure 12-25. Warm front cross-section with surface weather chart depiction and associated METAR.
12-19