FAA-H-8083-25C · Source PDF page 326
Aviation Weather Services
ATC Radar Weather Displays · PHAK page 13-16
Searchable transcription
Effective September 1, 2015, the four-panel Low Level of a precipitation area, but the specific character of that area
SFC-240 chart was replaced with a two-panel chart. The new (snow, rain, hail, VIRGA, etc.) cannot be determined. For
two-panel chart will be the same as the top two panels in the this reason, ATC refers to all weather areas displayed on ATC
former four-panel chart, depicting the freezing level and areas radar scopes as “precipitation.”
of IFR, MVFR, and moderate or greater turbulence. The bottom
two panels of the chart have been removed. In lieu of these ARTCC facilities normally use a Weather and Radar
bottom two panels, an enhanced surface chart that includes Processor (WARP) to display a mosaic of data obtained
fronts, pressure, precipitation type, precipitation intensity, and from multiple NEXRAD sites. There is a time delay between
weather type, is displayed. The green precipitation polygons actual conditions and those displayed to the controller.
will be replaced by shaded precipitation areas using the The precipitation data on the ARTCC controller’s display
National Digital Forecast Database (NDFD) weather grid. could be up to 6 minutes old. The WARP processor is only
used in ARTCC facilities. All ATC facilities using radar
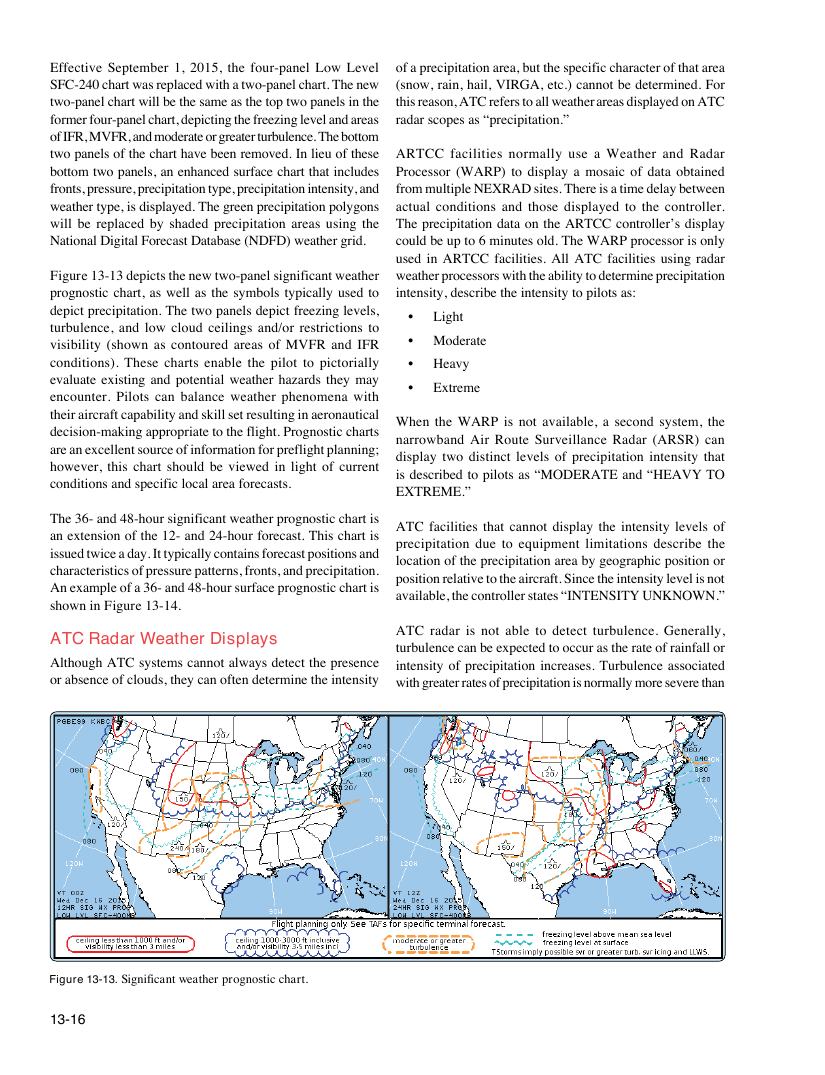
Figure 13-13 depicts the new two-panel significant weather weather processors with the ability to determine precipitation
prognostic chart, as well as the symbols typically used to intensity, describe the intensity to pilots as:
depict precipitation. The two panels depict freezing levels,
• Light
turbulence, and low cloud ceilings and/or restrictions to
• Moderate
visibility (shown as contoured areas of MVFR and IFR
conditions). These charts enable the pilot to pictorially • Heavy
evaluate existing and potential weather hazards they may
• Extreme
encounter. Pilots can balance weather phenomena with
their aircraft capability and skill set resulting in aeronautical
When the WARP is not available, a second system, the
decision-making appropriate to the flight. Prognostic charts
narrowband Air Route Surveillance Radar (ARSR) can
are an excellent source of information for preflight planning;
display two distinct levels of precipitation intensity that
however, this chart should be viewed in light of current
is described to pilots as “MODERATE and “HEAVY TO
conditions and specific local area forecasts.
EXTREME.”
The 36- and 48-hour significant weather prognostic chart is
ATC facilities that cannot display the intensity levels of
an extension of the 12- and 24-hour forecast. This chart is
precipitation due to equipment limitations describe the
issued twice a day. It typically contains forecast positions and
location of the precipitation area by geographic position or
characteristics of pressure patterns, fronts, and precipitation.
position relative to the aircraft. Since the intensity level is not
An example of a 36- and 48-hour surface prognostic chart is
available, the controller states “INTENSITY UNKNOWN.”
shown in Figure 13-14.
ATC radar is not able to detect turbulence. Generally,
ATC Radar Weather Displays
turbulence can be expected to occur as the rate of rainfall or
Although ATC systems cannot always detect the presence intensity of precipitation increases. Turbulence associated
or absence of clouds, they can often determine the intensity with greater rates of precipitation is normally more severe than
Figure 13-13. Significant weather prognostic chart.
13-16