FAA-H-8083-25C · Source PDF page 325
Aviation Weather Services
Weather Charts · PHAK page 13-15
Searchable transcription
Weather Depiction Chart ceiling height, weather, and obstructions to visibility, but
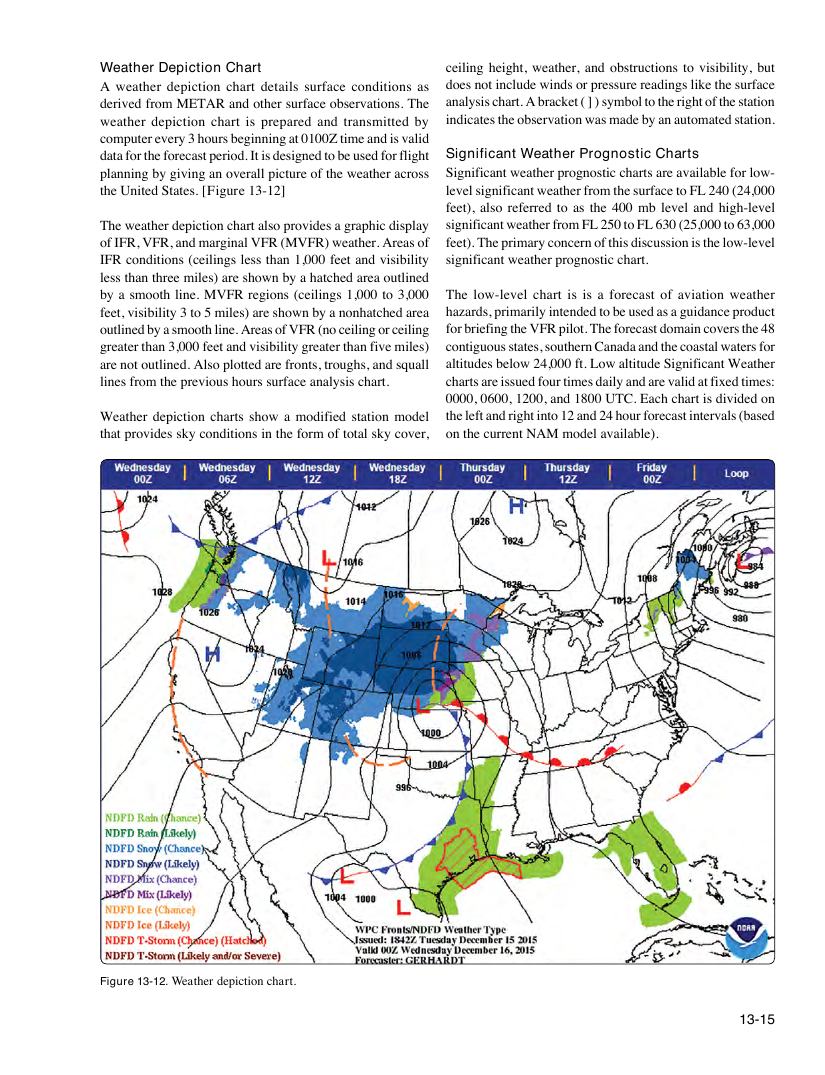
A weather depiction chart details surface conditions as does not include winds or pressure readings like the surface
derived from METAR and other surface observations. The analysis chart. A bracket ( ] ) symbol to the right of the station
weather depiction chart is prepared and transmitted by indicates the observation was made by an automated station.
computer every 3 hours beginning at 0100Z time and is valid
data for the forecast period. It is designed to be used for flight Significant Weather Prognostic Charts
planning by giving an overall picture of the weather across Significant weather prognostic charts are available for low-
the United States. [Figure 13-12] level significant weather from the surface to FL 240 (24,000
feet), also referred to as the 400 mb level and high-level
The weather depiction chart also provides a graphic display significant weather from FL 250 to FL 630 (25,000 to 63,000
of IFR, VFR, and marginal VFR (MVFR) weather. Areas of feet). The primary concern of this discussion is the low-level
IFR conditions (ceilings less than 1,000 feet and visibility significant weather prognostic chart.
less than three miles) are shown by a hatched area outlined
by a smooth line. MVFR regions (ceilings 1,000 to 3,000 The low-level chart is is a forecast of aviation weather
feet, visibility 3 to 5 miles) are shown by a nonhatched area hazards, primarily intended to be used as a guidance product
outlined by a smooth line. Areas of VFR (no ceiling or ceiling for briefing the VFR pilot. The forecast domain covers the 48
greater than 3,000 feet and visibility greater than five miles) contiguous states, southern Canada and the coastal waters for
are not outlined. Also plotted are fronts, troughs, and squall altitudes below 24,000 ft. Low altitude Significant Weather
lines from the previous hours surface analysis chart. charts are issued four times daily and are valid at fixed times:
0000, 0600, 1200, and 1800 UTC. Each chart is divided on
Weather depiction charts show a modified station model the left and right into 12 and 24 hour forecast intervals (based
that provides sky conditions in the form of total sky cover, on the current NAM model available).
Figure 13-12. Weather depiction chart.
13-15