FAA-H-8083-25C · Source PDF page 401
Navigation
Step 1 · PHAK page 16-14
Searchable transcription
33 N 3
03 6
W E E P
Course and groundspeed
24 12
21
S
15
Heading
and
airspeed
W
16-14
yticolev
dna
noitcerid
dniW
N
080°
heading and 120
knots
airspeed
Wind at 20°
direction and
33 N 3 35 knots velocity 03 6
W E 090° course and 110 knots groundspeed
24 12
21 15
S
S
N
S
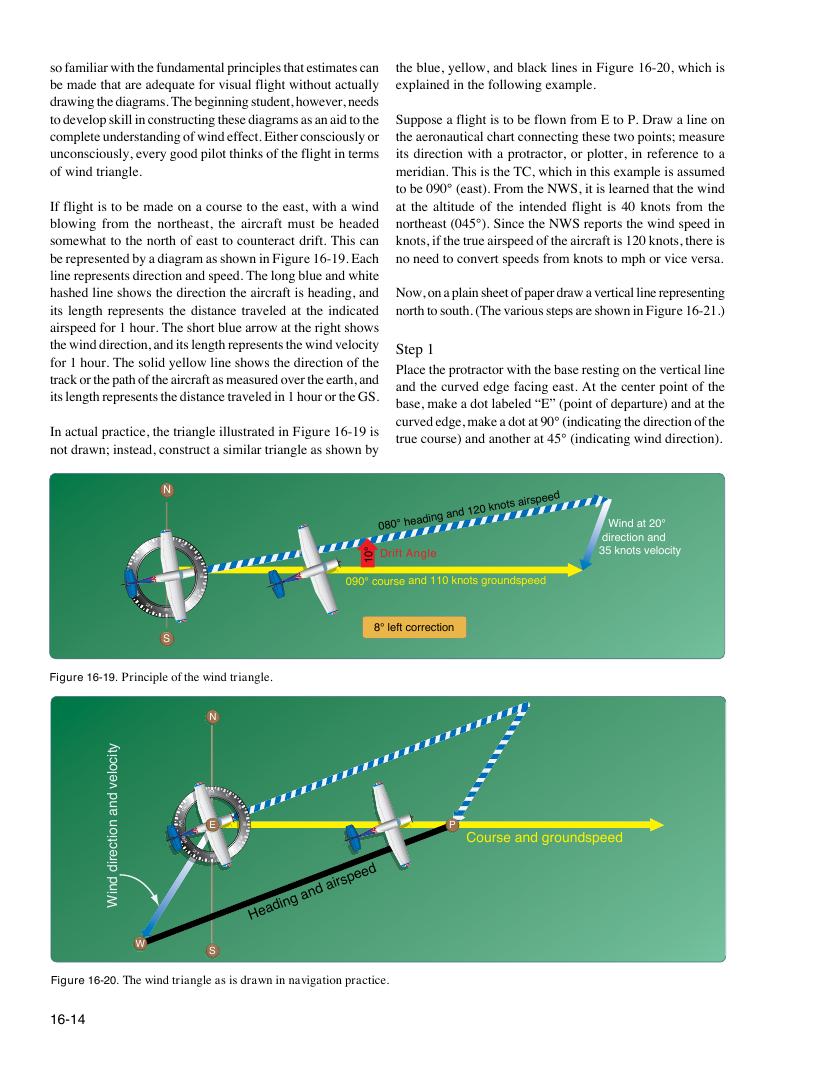
Figure 16-20. The wind triangle as is drawn in navigation practice.
°01
so familiar with the fundamental principles that estimates can the blue, yellow, and black lines in Figure 16-20, which is
be made that are adequate for visual flight without actually explained in the following example.
drawing the diagrams. The beginning student, however, needs
to develop skill in constructing these diagrams as an aid to the Suppose a flight is to be flown from E to P. Draw a line on
complete understanding of wind effect. Either consciously or the aeronautical chart connecting these two points; measure
unconsciously, every good pilot thinks of the flight in terms its direction with a protractor, or plotter, in reference to a
of wind triangle. meridian. This is the TC, which in this example is assumed
to be 090° (east). From the NWS, it is learned that the wind
If flight is to be made on a course to the east, with a wind at the altitude of the intended flight is 40 knots from the
blowing from the northeast, the aircraft must be headed northeast (045°). Since the NWS reports the wind speed in
somewhat to the north of east to counteract drift. This can knots, if the true airspeed of the aircraft is 120 knots, there is
be represented by a diagram as shown in Figure 16-19. Each no need to convert speeds from knots to mph or vice versa.
line represents direction and speed. The long blue and white
hashed line shows the direction the aircraft is heading, and Now, on a plain sheet of paper draw a vertical line representing
its length represents the distance traveled at the indicated north to south. (The various steps are shown in Figure 16-21.)
airspeed for 1 hour. The short blue arrow at the right shows
the wind direction, and its length represents the wind velocity Step 1
for 1 hour. The solid yellow line shows the direction of the
Place the protractor with the base resting on the vertical line
track or the path of the aircraft as measured over the earth, and
and the curved edge facing east. At the center point of the
its length represents the distance traveled in 1 hour or the GS.
base, make a dot labeled “E” (point of departure) and at the
curved edge, make a dot at 90° (indicating the direction of the
In actual practice, the triangle illustrated in Figure 16-19 is
true course) and another at 45° (indicating wind direction).
not drawn; instead, construct a similar triangle as shown by
Drift Angle
8° left correction
Figure 16-19. Principle of the wind triangle.