FAA-H-8083-25C · Source PDF page 281
Aircraft Performance
Performance Charts · PHAK page 11-25
Searchable transcription
14 -13°
12 -9°
10 -5°
8 -1°
6 3°
4 7°
2 11°
S.L. 15°
450 500 550 600 500 550 600 650
Range (nautical miles)
(Includes distance to climb and descend)
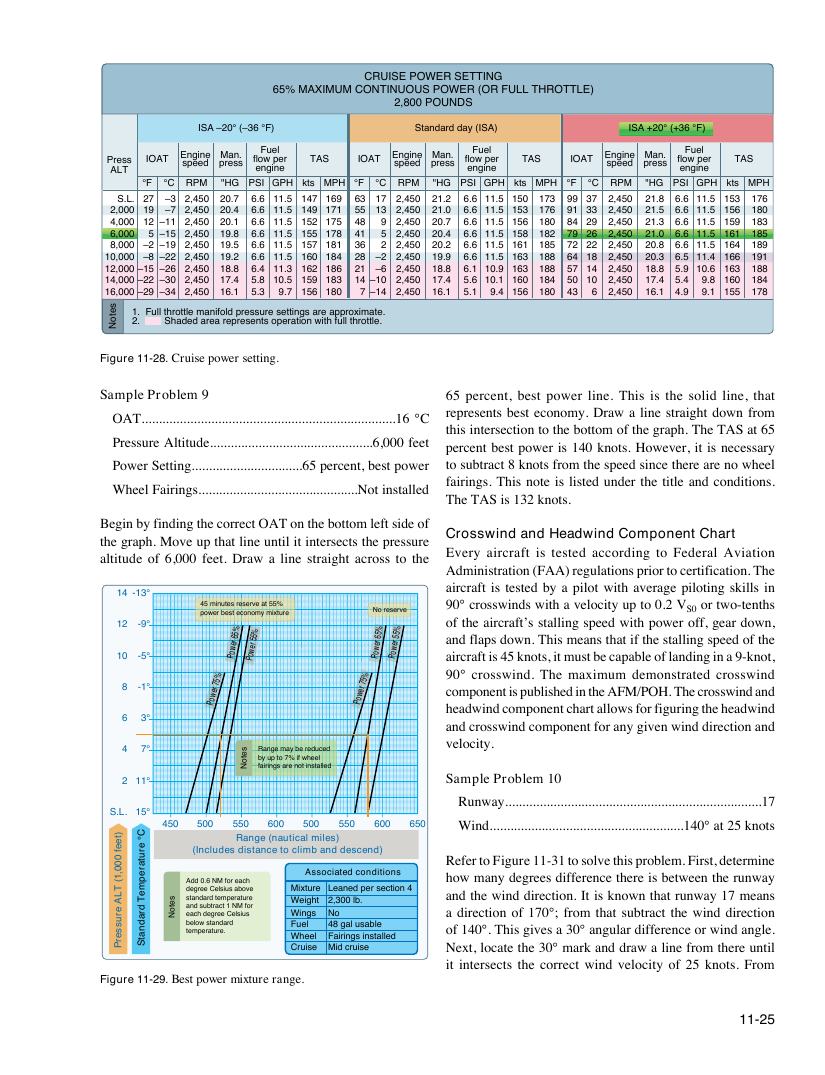
Figure 11-29. Best power mixture range.
11-25
)teef
000,1(
TLA
erusserP
C°
erutarepmeT
dradnatS
Po
wer
65 %
Po
wer
55 %
Po
wer
65 %
Po
wer
55 %
% %
Po
wer
75
Po
wer
75
Associated conditions
Mixture Leaned per section 4
Weight 2,300 lb.
Wings No
Fuel 48 gal usable
Wheel Fairings installed
Cruise Mid cruise
setoN Range may be reduced
by up to 7% if wheel
fairings are not installed
setoN
CRUISE POWER SETTING
65% MAXIMUM CONTINUOUS POWER (OR FULL THROTTLE)
2,800 POUNDS
ISA –20° (–36 °F) Standard day (ISA) ISA +20° (+36 °F)
Fuel Fuel Fuel
Engine Man. Engine Man. Engine Man.
Press IOAT speed press flow per TAS IOAT speed press flow per TAS IOAT speed press flow per TAS
ALT engine engine engine
°F °C RPM "HG PSI GPH kts MPH °F °C RPM "HG PSI GPH kts MPH °F °C RPM "HG PSI GPH kts MPH
S.L. 27 –3 2,450 20.7 6.6 11.5 147 169 63 17 2,450 21.2 6.6 11.5 150 173 99 37 2,450 21.8 6.6 11.5 153 176
2,000 19 –7 2,450 20.4 6.6 11.5 149 171 55 13 2,450 21.0 6.6 11.5 153 176 91 33 2,450 21.5 6.6 11.5 156 180
4,000 12 –11 2,450 20.1 6.6 11.5 152 175 48 9 2,450 20.7 6.6 11.5 156 180 84 29 2,450 21.3 6.6 11.5 159 183
6,000 5 –15 2,450 19.8 6.6 11.5 155 178 41 5 2,450 20.4 6.6 11.5 158 182 79 26 2,450 21.0 6.6 11.5 161 185
8,000 –2 –19 2,450 19.5 6.6 11.5 157 181 36 2 2,450 20.2 6.6 11.5 161 185 72 22 2,450 20.8 6.6 11.5 164 189
10,000 –8 –22 2,450 19.2 6.6 11.5 160 184 28 –2 2,450 19.9 6.6 11.5 163 188 64 18 2,450 20.3 6.5 11.4 166 191
12,000 –15 –26 2,450 18.8 6.4 11.3 162 186 21 –6 2,450 18.8 6.1 10.9 163 188 57 14 2,450 18.8 5.9 10.6 163 188
14,000 –22 –30 2,450 17.4 5.8 10.5 159 183 14 –10 2,450 17.4 5.6 10.1 160 184 50 10 2,450 17.4 5.4 9.8 160 184
16,000 –29 –34 2,450 16.1 5.3 9.7 156 180 7 –14 2,450 16.1 5.1 9.4 156 180 43 6 2,450 16.1 4.9 9.1 155 178
1. Full throttle manifold pressure settings are approximate.
2. Shaded area represents operation with full throttle.
Figure 11-28. Cruise power setting.
45 minutes reserve at 55% power best economy mixture No reserve
Add 0.6 NM for each
degree Celsius above
standard temperature
and subtract 1 NM for each degree Celsius
below standard
temperature.
setoN
Sample Problem 9 65 percent, best power line. This is the solid line, that
represents best economy. Draw a line straight down from
OAT.........................................................................16 °C
this intersection to the bottom of the graph. The TAS at 65
Pressure Altitude...............................................6,000 feet
percent best power is 140 knots. However, it is necessary
Power Setting................................65 percent, best power to subtract 8 knots from the speed since there are no wheel
fairings. This note is listed under the title and conditions.
Wheel Fairings..............................................Not installed
The TAS is 132 knots.
Begin by finding the correct OAT on the bottom left side of
Crosswind and Headwind Component Chart
the graph. Move up that line until it intersects the pressure
Every aircraft is tested according to Federal Aviation
altitude of 6,000 feet. Draw a line straight across to the
Administration (FAA) regulations prior to certification. The
aircraft is tested by a pilot with average piloting skills in
90° crosswinds with a velocity up to 0.2 V or two-tenths S0
of the aircraft’s stalling speed with power off, gear down,
and flaps down. This means that if the stalling speed of the
aircraft is 45 knots, it must be capable of landing in a 9-knot,
90° crosswind. The maximum demonstrated crosswind
component is published in the AFM/POH. The crosswind and
headwind component chart allows for figuring the headwind
and crosswind component for any given wind direction and
velocity.
Sample Problem 10
Runway..........................................................................17
Wind........................................................140° at 25 knots
Refer to Figure 11-31 to solve this problem. First, determine
how many degrees difference there is between the runway
and the wind direction. It is known that runway 17 means
a direction of 170°; from that subtract the wind direction
of 140°. This gives a 30° angular difference or wind angle.
Next, locate the 30° mark and draw a line from there until
it intersects the correct wind velocity of 25 knots. From