FAA-H-8083-25C · Source PDF page 282
Aircraft Performance
Performance Charts · PHAK page 11-26
Searchable transcription
Crosswind component
Figure 10-31. Crosswind component chart.
11-26
tnenopmoc
dniwdaeH
2
0,000
% % %
18,0 1 0 6 0 , 1 0 4 0 1 , 0 0 2 0 ,0 0 00 Pressure ALT (feet) Po wer
55
Po wer
65
Po wer
75
Weight Associa 3 t ,6 e 0 d 0 c l o b n . d gr it o i s o s n s weight 10,000 Flaps Up 8,000 Best power Mixture leaned to 100° 6,000
Best economy
r
M
ic
i
h
xt u
o
r
f
e
p
l
e
e
a
a
k
n e
E
d
G
t
T
o peak EGT 4,000 1,650° Max allowable EGT
2,000 Sea level Wheel Fairings installed
–40° –30° –20° –10° 0° 10° 20° 30° 40° 100 120 140 160 180 200
Outside air temperature (°C) True airspeed (knots)
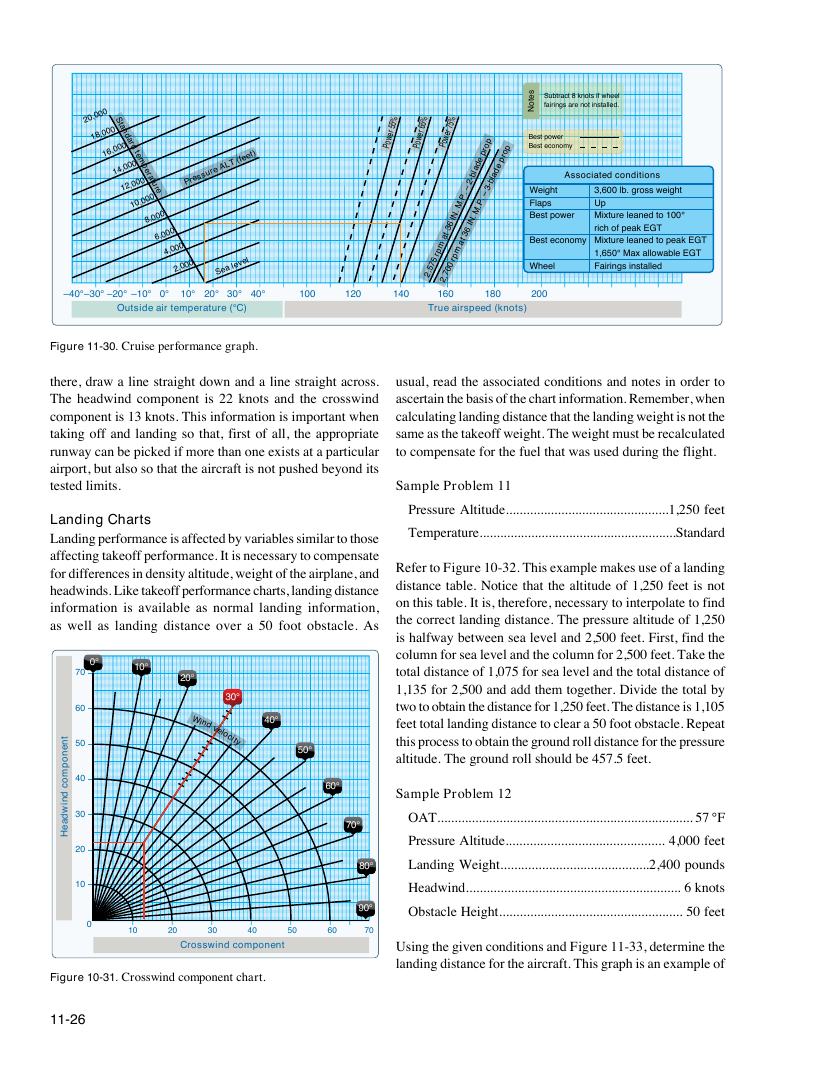
Figure 11-30. Cruise performance graph.
0°
10° 70
20°
30°
60
50
Wind
velocity
40°
50°
40
60°
30
70°
20
80°
10
90°
0
10 20 30 40 50 60 70
setoN Subtract 8 knots if wheel
fairings are not installed.
S
tan
d ard tem p eratu re
p m
at 3 6 I N
m
. M
a
. P
t
. 3 – 6 2 I N - b . l a M d . e P . p – r o 3 p - bla d e pr o p B B e e s s t t p e o co w n e o r my
2, 5 7 5
r
2,
70 0 r
p
there, draw a line straight down and a line straight across. usual, read the associated conditions and notes in order to
The headwind component is 22 knots and the crosswind ascertain the basis of the chart information. Remember, when
component is 13 knots. This information is important when calculating landing distance that the landing weight is not the
taking off and landing so that, first of all, the appropriate same as the takeoff weight. The weight must be recalculated
runway can be picked if more than one exists at a particular to compensate for the fuel that was used during the flight.
airport, but also so that the aircraft is not pushed beyond its
tested limits. Sample Problem 11
Pressure Altitude...............................................1,250 feet
Landing Charts
Temperature.........................................................Standard
Landing performance is affected by variables similar to those
affecting takeoff performance. It is necessary to compensate
Refer to Figure 10-32. This example makes use of a landing
for differences in density altitude, weight of the airplane, and
distance table. Notice that the altitude of 1,250 feet is not
headwinds. Like takeoff performance charts, landing distance
on this table. It is, therefore, necessary to interpolate to find
information is available as normal landing information,
the correct landing distance. The pressure altitude of 1,250
as well as landing distance over a 50 foot obstacle. As
is halfway between sea level and 2,500 feet. First, find the
column for sea level and the column for 2,500 feet. Take the
total distance of 1,075 for sea level and the total distance of
1,135 for 2,500 and add them together. Divide the total by
two to obtain the distance for 1,250 feet. The distance is 1,105
feet total landing distance to clear a 50 foot obstacle. Repeat
this process to obtain the ground roll distance for the pressure
altitude. The ground roll should be 457.5 feet.
Sample Problem 12
OAT.......................................................................... 57 °F
Pressure Altitude.............................................. 4,000 feet
Landing Weight...........................................2,400 pounds
Headwind.............................................................. 6 knots
Obstacle Height..................................................... 50 feet
Using the given conditions and Figure 11-33, determine the
landing distance for the aircraft. This graph is an example of