FAA-H-8083-25C · Source PDF page 283
Aircraft Performance
Performance Charts · PHAK page 11-27
Searchable transcription
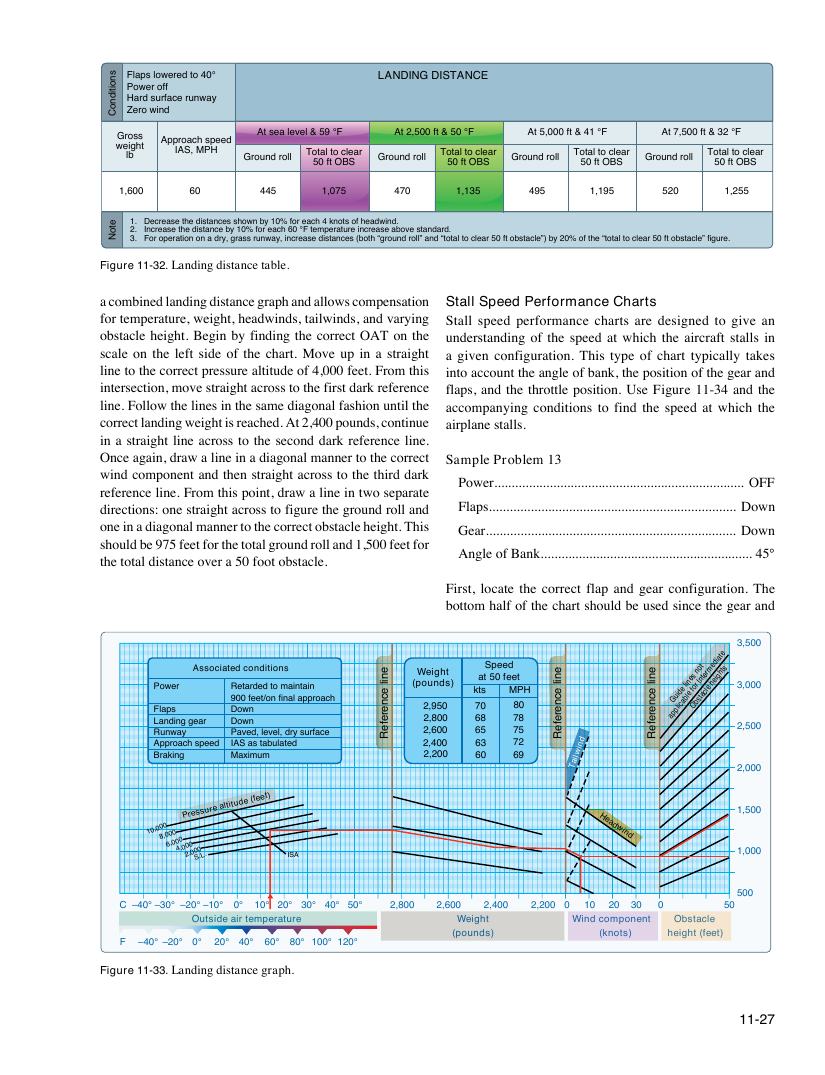
Figure 11-32. Landing distance table.
3,500
P F
L R a
l o
u
a
n
w
n
p
d w
e s
i n
r
a g y g
A
ea
s
r
s ociate R 9 D
D P
d 0
a
o
o
e 0
v
t w
w
c a
e
f o n
n
r e
d
d n e
,
e d t
l
d
e
/ i o t
v
t i n o
e
o
l
f n
,
m i n s
d
a a
r
i
y
l n a t
s
a p
u
i p n
rf
r
a
o
c
a
e
ch e n il e c n e
re fe R
(p W o 2
2 2
e u ,
, ,
9
6
i
8
n g 5
0 0
d h 0
0 0
s t ) k 7
6 6
a t 0
8 5
s t S 5 p 0 e e fe d M e
7 7
8 P t
8 5
0 H e n il e c n e
re fe R
e n il e c n e
re fe R a
G pp u l i i d c e a b li l n e e f O s o b r n s o In t t a t c e l r e m h e e d i i g a h
te
ts 3
2
,
,
0
5
0
0
0
0
Approach speed IAS as tabulated 2,400 63 72 n d
Braking Maximum 2,200 60 69 ail
wi
T 2,000
10,00
8
0
,0 6 0 ,0 0 0 4 0 ,0
P
2 0
r
, 0 0
e
0 S
s
0 .
s
L
u
.
re
altitude
(feet)
ISA
Headwind 1
1
,
,
5
0
0
0
0
0
500
C –40° –30° –20° –10° 0° 10° 20° 30° 40° 50° 2,800 2,600 2,400 2,200 0 10 20 30 0 50
Outside air temperature W eight Wind component Obstacle
(pounds) (knots) height ( feet)
F –40° –20° 0° 20° 40° 60° 80° 100° 120°
Figure 11-33. Landing distance graph.
11-27
etoN
LANDING DISTANCE snoitidnoC Flaps lowered to 40°
Power off
Hard surface runway
Zero wind
Gross Approach speed At sea level & 59 °F At 2,500 ft & 50 °F At 5,000 ft & 41 °F At 7,500 ft & 32 °F
we l i b ght IAS, MPH Ground roll Total to clear Ground roll Total to clear Ground roll Total to clear Ground roll Total to clear
50 ft OBS 50 ft OBS 50 ft OBS 50 ft OBS
1,600 60 445 1,075 470 1,135 495 1,195 520 1,255
1. Decrease the distances shown by 10% for each 4 knots of headwind.
2. Increase the distance by 10% for each 60 °F temperature increase above standard.
3. For operation on a dry, grass runway, increase distances (both “ground roll” and “total to clear 50 ft obstacle”) by 20% of the “total to clear 50 ft obstacle” figure.
a combined landing distance graph and allows compensation Stall Speed Performance Charts
for temperature, weight, headwinds, tailwinds, and varying Stall speed performance charts are designed to give an
obstacle height. Begin by finding the correct OAT on the understanding of the speed at which the aircraft stalls in
scale on the left side of the chart. Move up in a straight a given configuration. This type of chart typically takes
line to the correct pressure altitude of 4,000 feet. From this into account the angle of bank, the position of the gear and
intersection, move straight across to the first dark reference flaps, and the throttle position. Use Figure 11-34 and the
line. Follow the lines in the same diagonal fashion until the accompanying conditions to find the speed at which the
correct landing weight is reached. At 2,400 pounds, continue airplane stalls.
in a straight line across to the second dark reference line.
Once again, draw a line in a diagonal manner to the correct Sample Problem 13
wind component and then straight across to the third dark
Power........................................................................ OFF
reference line. From this point, draw a line in two separate
directions: one straight across to figure the ground roll and Flaps....................................................................... Down
one in a diagonal manner to the correct obstacle height. This Gear........................................................................ Down
should be 975 feet for the total ground roll and 1,500 feet for
Angle of Bank............................................................. 45°
the total distance over a 50 foot obstacle.
First, locate the correct flap and gear configuration. The
bottom half of the chart should be used since the gear and